

First of all, search the data you seek (no registration required)
* Registration required for download.
Search by:


Physical quantities
precipitation, ocean color, etc.


Spacecraft
spacecraft, sensor, level, etc.


Direct download
How to download via FTP, etc.


Login

User registration

Search this site:


June 29 2020 Publish in

This time, we will introduce an example of how to read and visualize the GCOM-C (SHIKISAI) product provided from G-Portal by using "QGIS". Explanation is divided 4 documents (6 steps in total) in orde

March 17 2020 Publish in

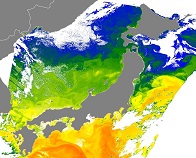
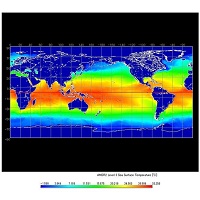
The SST products handled by G-Portal are mainly products created from GCOM-W (Shizuku) observation data and products created from GCOM-C (Shikisai) observation data. Although the two products

March 17 2020 Publish in

The 1st (This time): The advantage of G-Portal
 Example of use by years