

First of all, search the data you seek (no registration required)
* Registration required for download.
Search by:


Physical quantities
precipitation, ocean color, etc.


Spacecraft
spacecraft, sensor, level, etc.


Direct download
How to download via FTP, etc.


Login

User registration

Search this site:


Imaging procedure for GCOM-C (SHIKISAI) products using QGIS
June 29 2020 Publish in

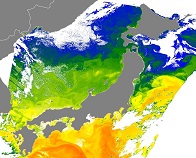
This time, we will introduce an example of how to read and visualize the GCOM-C (SHIKISAI) product provided from G-Portal by using "QGIS". Explanation is divided 4 documents (6 steps in total) in order to its purpose, and it is contained the procedure of change the color ramp as an appendix too.
STEP1 : Prepare 1 - Download the land data input to QGIS –
STEP2 : Prepare 2 - Convert sea surface temperature data to "GeoTIFF" format –
Imaging procedure for GCOM-C (SHIKISAI) product by using QGIS(Step.1-2)
STEP3 : Read the data with QGIS
STEP4 : Convert pixel data (digital value) to sea surface temperature
Imaging procedure for GCOM-C (SHIKISAI) product by using QGIS(Step.3-4)
STEP5 : Display sea surface temperature in color
STEP6 : Adjust the image and save it as your own data
Imaging procedure for GCOM-C (SHIKISAI) product by using QGIS(Step.5-6)
(Appendix) How to change the color ramp
Imaging procedure_for_GCOM-C(SHIKISAI)_product_by_using_QGIS(Appendix)
What's QGIS?
QGIS is an Open Source GIS application and you can use it free of charge. There are QGIS has many functions, and they are very useful.
The following page contains a lot of useful information for users.
https://qgis.org/en/site/
 Example of use by years