This time, we will focus on one of the satellite products "Land Surface Temperature (LST) Products", and will introduce the usage applicability and the procedure to actually visualize the LST products as an image.
The LST products currently provided by G-Portal are products created from the observation data of GCOM-C (Shikisai). The abnormal temperatures in urban areas during the summer, which have been continuing for several years, are affected by land use patterns. Therefore, it is expected that it will be important from the viewpoint of urban engineering to observe the land surface temperature over wide areas.
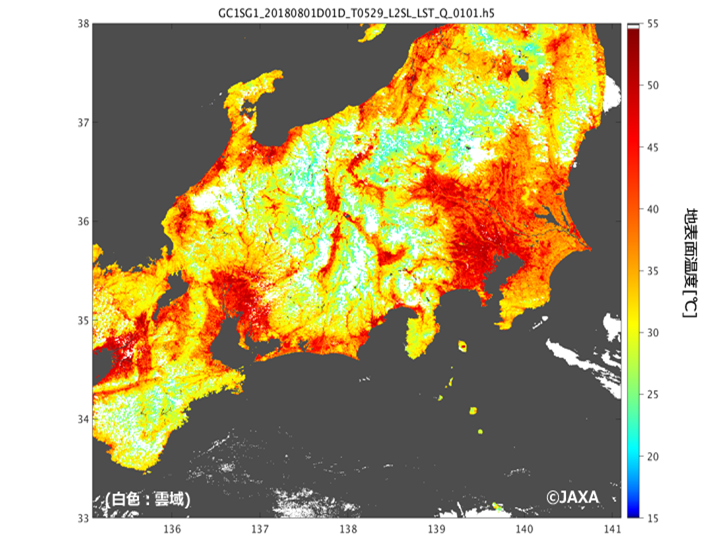 Figure: An example of GCOM-C LST product
(Authority: JAXA/EORC "Seen from Space"site)
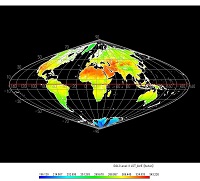
Figure: An example of GCOM-C LST product
(Authority: JAXA/EORC "Seen from Space"site)
Global LST products with 250m spatial resolution are created from GCOM-C observation data and JAXA cooperates with domestic and overseas research institutions to contribute to solving global issues such as climate change.
In addition to these scientific uses, efforts to utilize LST products for yield estimation of crops and volcano monitoring have been attracted attention in late years.


 Example of use by years