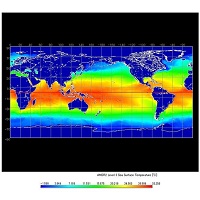
This time, we will focus on one of the satellite products "Sea Surface Temperature (SST) Products", and will introduce the usage trends and the procedure to actually visualize the SST products as an image.
The SST products handled by G-Portal are mainly products created from GCOM-W (Shizuku) observation data and products created from GCOM-C (Shikisai) observation data. Although the two products are similar, there are two decisive differences.
The first difference is a spatial resolution that is the size of the space that is the minimum unit of observation and it is expressed as the distance of a square piece.
GCOM-W SST products have a spatial resolution of 50km. On the other hand, GCOM-C SST products have a spatial resolution of 250m.
Therefore, GCOM-C SST products are the capable of measuring the sea surface temperature 200 times finer than GCOM-W SST products.
And GCOM-W is not good at acquiring the sea surface temperature in coastal areas.
The second difference is that it is susceptible to the effect due to differences in observation principles.
GCOM-W SST products are less affected by clouds and they have the sea surface temperature under clouds. On the other hand,
GCOM-C SST products are affected by clouds and they don’t have the sea surface temperature under clouds. (For more information, please refer to the Tools/Documents section).
Global SST products are created from GCOM-W and GCOM-C and JAXA cooperates with domestic and overseas research institutions to contribute to solving global issues such as water cycle change and climate change.
In addition to these scientific uses, efforts to utilize SST products for fishing ground search have been attracted attention in late years. (For more information, please refer to the Use Cases section
"Case Studies – Fishery demonstrated by GCOM").


 Example of use by years