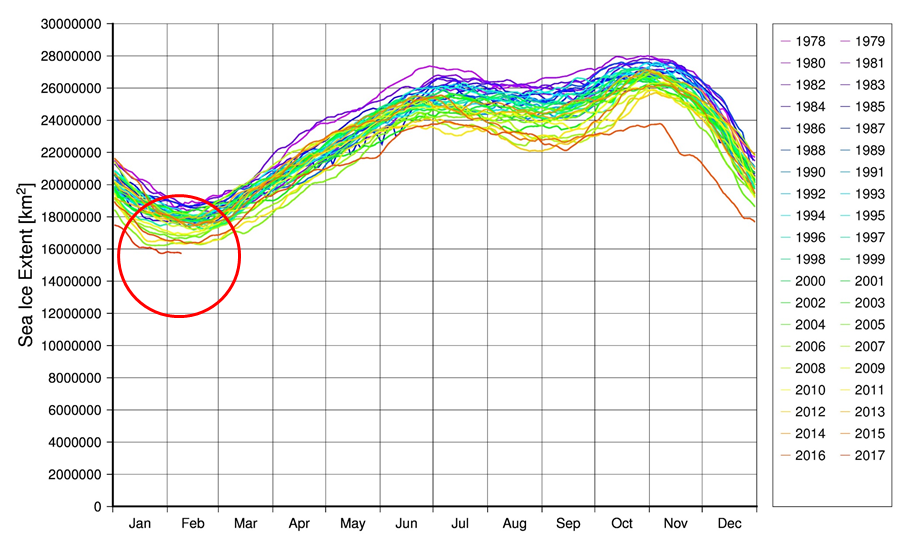


Figure 1. Annual seasonal changes in area of global sea ice for both Arctic and Antarctic. Red circle indicates minimum value. These long-term sea ice data have been recorded since 1978 and were created using AMSR2 and other microwave radiometer data.
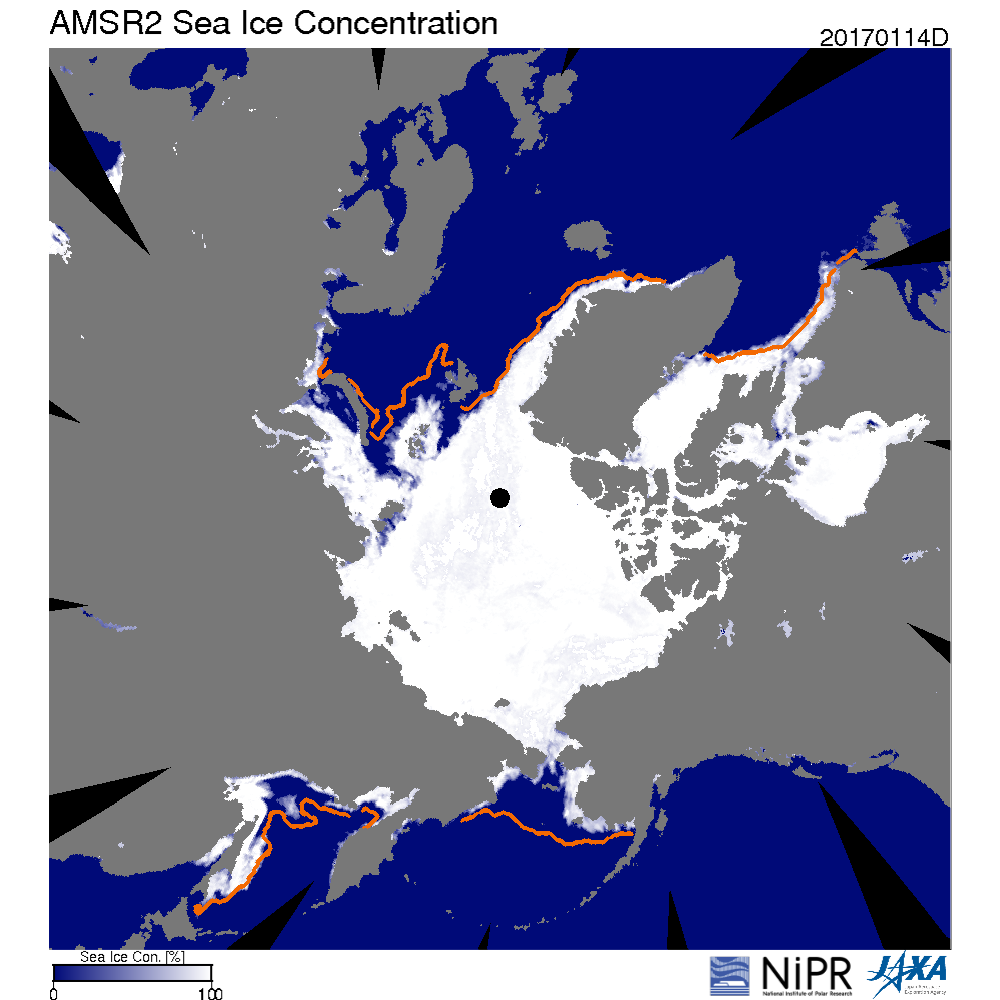
The area of sea ice in the Arctic Ocean had reportedly been shrinking prior to November 2016, but it then began to slowly increase during the ice formation period. However, it then began to shrink again and reached a minimum in February 2017.

Figure 2. Distribution of sea ice in Arctic Ocean on January 14, 2017. Orange
line indicates average sea ice edge distribution during the 2000s.
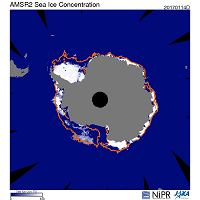
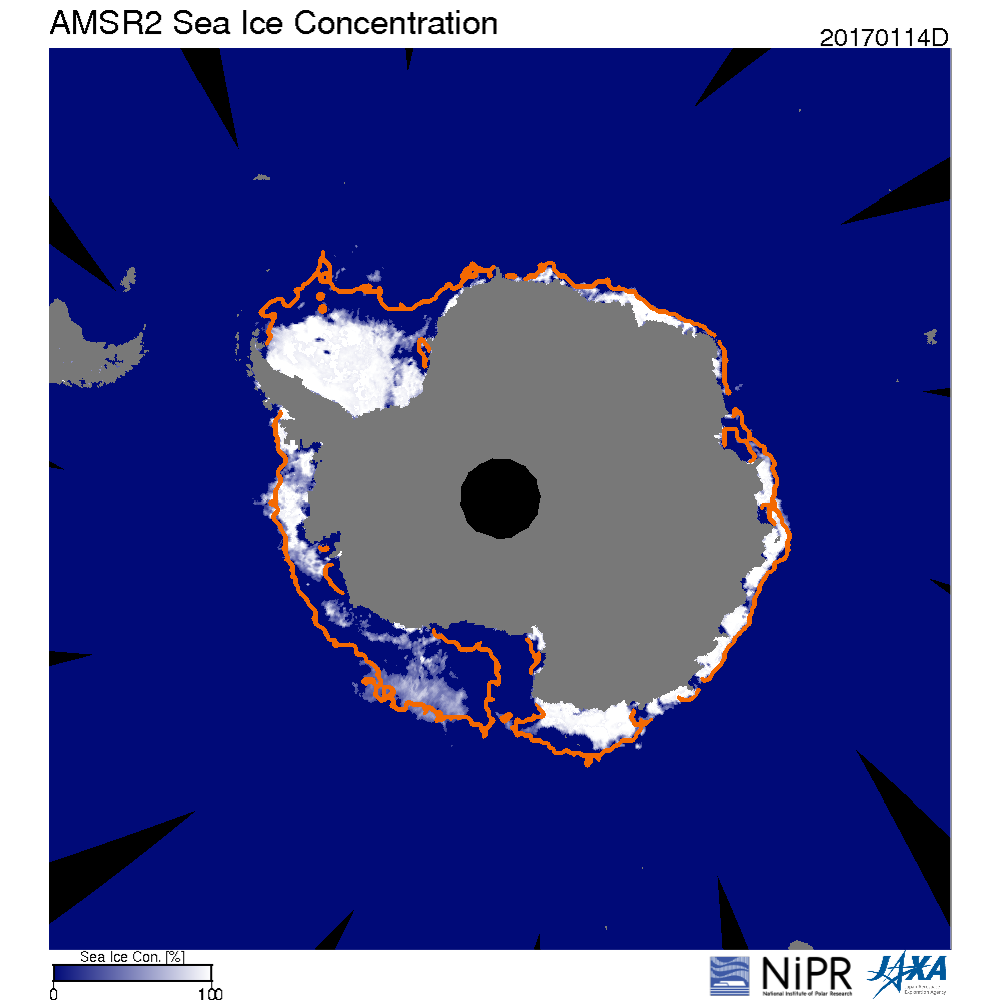
The sea ice area in the Antarctic Ocean had been increasing, but it began to decline sharply in (approximately) October 2016 and reached a minimum value in February 2017. This trend has now continued since 2017, and the current remaining area is very small.

Figure 3. Distribution of sea ice in Antarctic Ocean on January 14, 2017. Orange
line indicates average sea ice edge distribution during the 2000s.
Areas of global sea ice
undergo considerable annual changes; this influences the amount of light
available within the water. This subsequently affects plankton growth, the food
chain, and ultimately impacts human society. In addition, the feedback from ice
albedo affects the amount of water vapor transported, which thus provokes major
climate changes. Utilization of areas where ice is decreasing is being
proposed, such as development of an Arctic sea route.
 Example of use by years