The largest El Nino in observation
history (since 1950) occurred in 1997/98, and the magnitude of El Nino in 2015 approached
the same magnitude. According to the Japan Meteorological Agency on November
10, 2015, a difference of + 2.7 ° C from the reference sea surface temperature (SST)
value was recorded in the El Nino monitoring area in October, representing the
largest value since 1997.
During El Nino, SST in
the low middle–eastern equatorial Pacific rises higher than usual, due to weak
trade winds on the equator. La Nina is the opposite phenomenon to El Nino, and
both phenomena occur at sea. Satellites record their generation and
disappearance; in particular, the microwave radiometer can transmit information
obtained through clouds, measure the SST below, and make frequent observations,
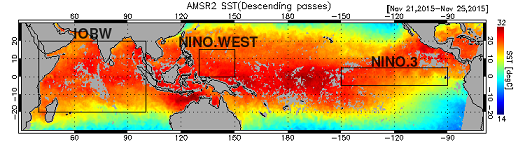
even in tropical sea areas where large scale convection systems develop. Figure
1 shows SST from the Indian Ocean from November 21 to 25, 2015, observed by the
Advanced Microwave Scanning Radiometer 2 (AMSR2) loaded on the Global Change
Observation Mission–Water (GCOM-W) satellite "Shizuku" launched by
JAXA. The boxes in the figure indicate El Nino monitoring areas. Using only
this figure, it is difficult to determine whether SST is higher than usual, but
Figure 2 shows differences from usual SST values for the same period. The light
blue to green colors represent almost normal SSTs, but red indicates higher
than usual SSTs and blue indicates the opposite state. It can be seen from this
figure, that SST was 3 ° C higher than usual over a wide range of the middle
and eastern Equatorial Pacific. Figure 3 shows changes in average SSTs from
2002 to 2015 for NINO.3, which is one of the El Nino monitoring areas.
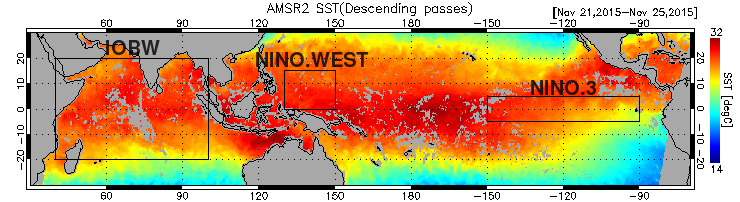
Figure 1. SST distribution in
tropical Indian Ocean–Pacific Ocean from 21 to 25 November 2015, observed by AMSR2.
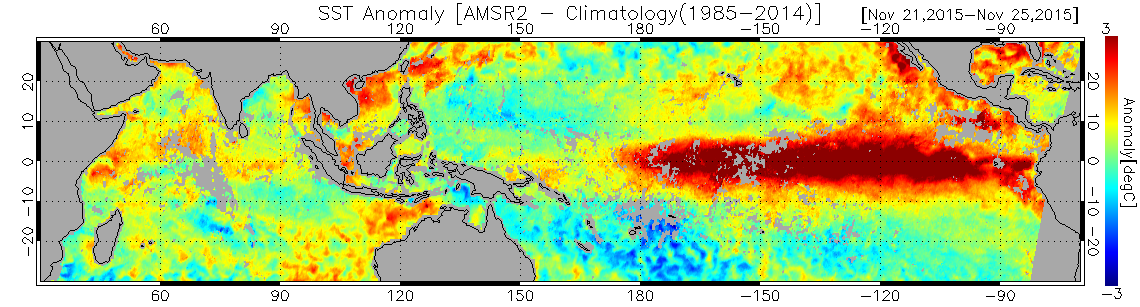
Figure 2. Same as Figure 1.
but showing distribution of the difference between actual SST obtained by AMSR2
and average SST according to the Japan Meteorological Agency.
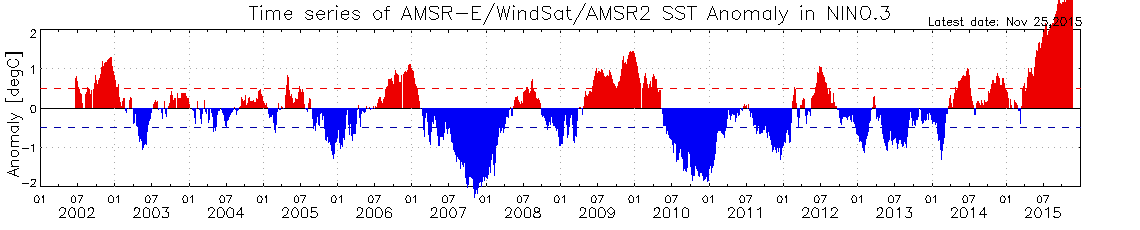
Figure 3. Time variation in
difference between actual and average SSTs from NINO.3 obtained between June
2002 and November 2015.
As the distribution of SST
changes with El Nino, the area where strong convection occurs in the tropics
also changes, which subsequently causes alterations in the distribution of
atmospheric circulation fields and precipitation. Figure 4 shows the distribution
of ground surface precipitation integrated from October 1 to November 28, 2015,
as observed by the two-frequency precipitation radar (DPR) loaded on the global
precipitation observation (GPM) main satellite. Figure 1 shows an area with
high SSTs, which indicates a large amount of precipitation. Figure 5 shows differences
in integrated ground surface precipitation between 2015 and 2014. Considerably
more precipitation fell in 2015 compared with 2014, as respectively indicated by
the red and blue colored areas. The area in which the amount of precipitation
increased underwent an expansion in response to the strong El Nino in the
Middle East Equatorial Pacific in 2015, and a reduction in precipitation in the
oceanic continents can be seen, such as near Indonesia. These changes in the
atmosphere and ocean also cause abnormal weather patterns; for example, the
start of the rainy season was delayed by El Nino to after July in 2015 in
Indonesia, but when it began there was an inadequate amount of precipitation to
extinguish the extensive forest fires, which were the largest ever recorded.
Normally, the effects of El Nino are the strongest in winter in the Northern
Hemisphere, and continual future monitoring of associated weather patterns is
necessary.
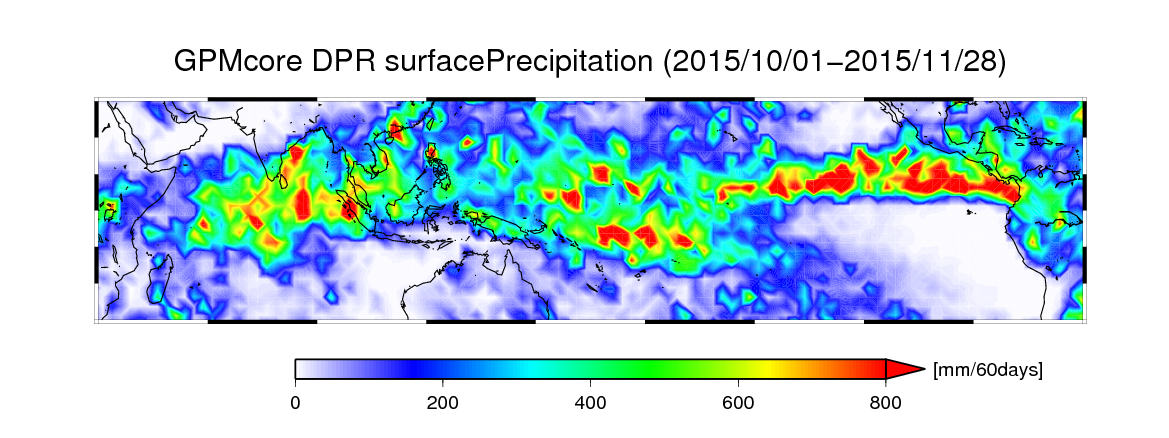
Figure 4. Integrated ground
surface precipitation distribution from October 1 to November 28, 2015 recorded
by DPR loaded on GPM main satellite.
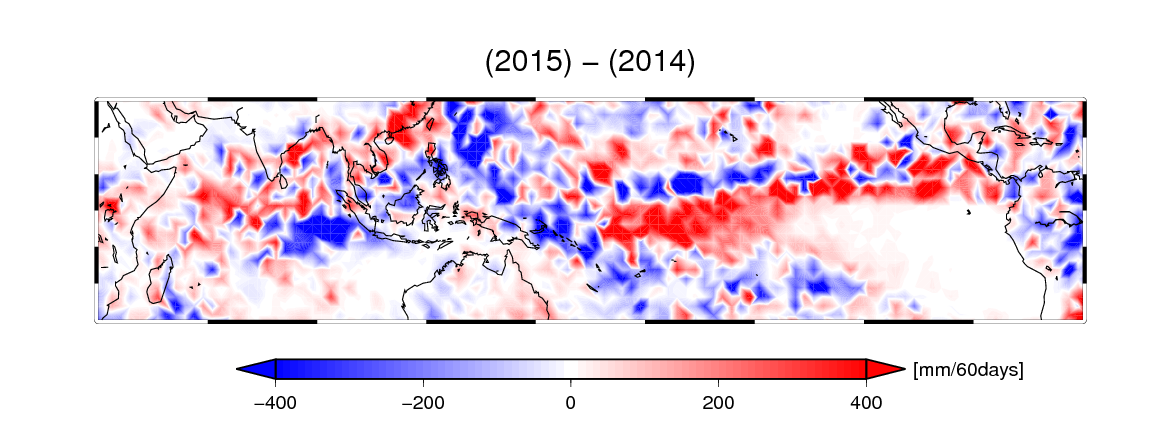
Figure 5. Same as Figure 4,
but showing difference in distribution between integrated ground surface
precipitation recorded by DPR in 2015 and that in 2014.


 Example of use by years